 Every so often, I read an article that gets me thinking in a different way about software value and software risk. Danilo Doneda of Rio de Janeiro State University and Virgilio Almeida of Harvard University recently published an article entitled, “What is Algorithm Governance?[1]”
Doneda and Almeida suggest that the time may have come to apply governance to algorithms because of the growing risks of intentional or unintentional, “… manipulation, biases, censorship, social discrimination, violations of privacy and property rights and more,” through the dynamic application of a relatively static algorithm to a relatively dynamic data set. By way of example, we have probably all experienced the unintended consequences of the application of a reasonably well understood algorithm to new data. We all have a basic grasp of what the Google search algorithm will do for us but some of you might have experienced embarrassment like mine when I typed in a perfectly innocent search term without thinking through the possible alternative meanings of that set of words (No, I’m not going to share). At the other end of the spectrum from the risk of relatively harmless misunderstandings, there is a risk that algorithms can be intentionally manipulative – the VW emission control algorithm that directed different behavior when it detected a test environment is a good example. For those of us who deal with outsourcing software development, it is impossible to test every delivered algorithm against every possible set of data and then validate the outcomes. If we consider software value, from a governance perspective, it should be desirable to understand how many algorithms we own and what they are worth. Clearly, the Google search algorithm is worth more than my company. But, are there any algorithms in your company’s software that represent trade secrets or even simple competitive differentiators? Which are the most valuable? How could their value be improved? Are they software assets that should be inventoried and managed? Are they software assets that could be sold or licensed? If data can gather and sell data then why not algorithms? From a software metrics perspective, it should be easy to identify and count the algorithms in a piece of software. Indeed, function point analysis might be a starting point using its rules for counting unique transactions, each of which presumably involves one or more algorithms, though it would be necessary to identify those algorithms that are used by many unique transactions (perhaps as a measure of the value of the algorithm?). Another possible perspective on the value of the algorithm might be on the nature of the data it processes. Again, function points might offer a starting point here but Doneda and Almeida offer a slightly different perspective. They mention three characteristics of the data that feeds “Big Data” algorithms, “… the 3 V’s: volume (more data are available), variety (from a wider number of sources), and velocity (at an increasing pace, even in real time). It seems to me that these characteristics could be used to form a parametric estimate of the risk and value associated with each algorithm. It is interesting to me that these potential software metrics appear to scale similarly for software value and software risk. That is, algorithms that are used more often are more valuable yet carry with them more risk. The same applies to algorithms that are potentially exposed to more data. [1] Doneda, Danilo & Almeida, Virgilio A.F. “What is Algorithm Governance.” IEEE Computer Edge. December 2016. Mike Harris, CEO  I was delighted to read a thought leadership article from McKinsey recently, “How to start building your next-generation operating model,” that emphasizes some key themes that I have been pushing for years (the quotes below are from the article):
While they promote organizing IT around business value streams, the McKinsey authors identify a risk to be mitigated in that value streams should start to build up software, tools and skills specific to each value stream. This might be contrary to the tendency in many organizations to make life easier for IT by picking a standard set of software, tools and skills across the whole organization. I agree that it would be a shame indeed if agile and lean principles that started life in IT software development are constrained by legacy IT attitudes as the agile and lean principles roll out into the broader organization. There are a lot more positive ideas for organizational transformation in the article, so I recommend that you take a few minutes to read it. My only small gripe is that while the authors emphasize organizing around value throughout, they do not mention prioritizing by business value. Maybe at the high level that McKinsey operates in organizations that concept is taken for granted. My experience is that as soon as you move away from the top level, if business value priorities are not explicit, then managers and teams will use various other criteria for prioritization and the overall results may be compromised. This blog was originally posted at https://www.softwarevalue.com/insights/blog/posts/2017/march/using-software-value-to-drive-organizational-transformation/.  Software brings tremendous value to organizations, but in today’s day and age, it also carries significant risk. Malicious cyberattacks continue to rise at a rapid pace. According to the Identity Theft Resource Center and CyberScout, data breaches increased by 40 percent in 2016 – that’s after a record year in 2015. With the ongoing upsurge in data breaches, software can be seen by many as a potential liability for an organization. We are such a data-driven economy today that criminals have realized that they can cause serious damages to companies, governments and other entities by hacking into their information systems and stealing, corrupting or deleting valuable data. These breaches are extremely costly to organizations – not only financially, but also to their reputations.
Just look at Target. In 2013, hackers stole credit card numbers of 110 million customers costing the retail giant approximately $162 million, in addition to a decrease in sales and a black eye to their reputation (for a short period of time). It’s no wonder that “94 percent of CISOs are concerned about breaches in their publicly facing assets in the next 12 months, particularly within their applications,” according to a January 2017 Bugcrowd study. However, despite these concerns, another survey of over 500 IT decision makers found that 83 percent of the respondents actually release their code before testing it or resolving known weaknesses (Veracode, September 2016). Software is typically at the foundation of all cybersecurity attacks. In fact, the Software Engineering Institute stated that 90 percent of reported security incidents result from exploits against defects in the design or code of software. If a network router is hacked, most likely the hacker went through the router’s software, not hardware. These breaches can pose such a significant threat to an organization’s value that software developers must make application security an integral part of the software development lifecycle. By finding and fixing vulnerabilities early in the software development lifecycle, there is less risk to the business and more potential for increased business value from the software. For example, Adobe Flash player is a product used by many websites to enable interactivity and multimedia. In 2015, it had more than 300 patches (TechBeacon’s Application Security Buyer’s Guide). Developing these patches is a resource drain (both time and money). On balance though the risk Adobe would run by not providing these patches could be significant and negatively impact the Adobe’s value as well as the value of the organizations using its product. So, if an application has, let’s say, 500 known weaknesses, the organization may not have the time or money to fix all of them before an imminent release. They need to collaborate with the business unit and determine which vulnerabilities pose the highest risk to the business (negative business value) and which ones, if remediated, will help to deliver the most value to the business if they are fixed. It is not unusual for developers to fix those vulnerabilities that are easiest to resolve; however, it is critical to take a step back and prioritize identified vulnerabilities based on business value. This post originally appeared at https://www.softwarevalue.com/insights/blog/posts/2017/february/how-does-cybersecurity-drive-the-business-value-of-software/ 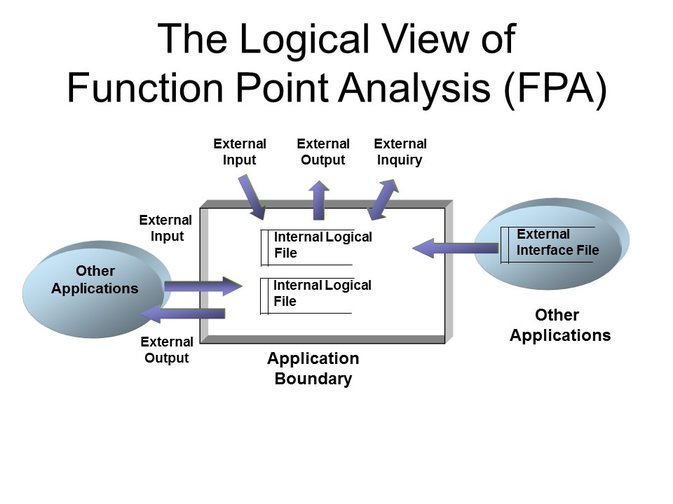 I participated in an interesting conversation on Function Points and Agile with members of the software development group at a federal agency recently. We, the DCG team, were explaining how we would start the process of measuring how much value they are delivering from software development by measuring how much functionality they are delivering in function points. For an organization with immature metrics and, perhaps, lack of user trust, this starting point takes the question of productivity off of the table to allow us to move on to end user value delivery
All of the participants in the meeting quickly recognized the value of having a standard metric, function points, to measure the size of the functionality being delivered (and with SNAP – the non-functional size too) but I could see on their faces the sort of trusting disbelief that might be associated with my pulling a rabbit out of my bag. Some of the participants in the meeting were not familiar with function points and asked for a quick, five minute explanation. I get asked this a lot so here it is (before I get inundated with corrections – I know – this is an over-simplification): Imagine a software application and draw an imaginary boundary around it in your mind to include all its functionality but not the functionality of other applications that it communicates with or draws information from. Now consider the diagram below. From a user perspective, looking at the application from outside the application boundary, I can interact with the application in three ways, called transaction functions: external inputs (EIs), external outputs (Eos) and external inquiries (same as input and output but with no change of data or state – EQs). From within the application, I can access data in two places – inside the application boundary or outside the application boundary. My interactions with these files are the two types of data functions: internal logical files (ILFs) where data is stored within the application boundary and external interface files (EIFs) where data is stored outside our application boundary. Most of you will be able to easily imagine that these five types of user interaction with our application can be more or less complex. If I want to produce a function point count, the next step is to consider the first of the transactions that the user wishes to perform on the application (as defined in the requirements, user stories or whatever) and to identify how many of each of the five function types is involved in the transaction and how complex that involvement is (low, average or high). Predetermined rules govern the weights that apply to each function type based on the complexity of the function in this transaction. With all this information gathered, we can calculate the number of function points using the simple table shown below. Function Point Counting Weights Type Low Avg High Total EI __ x 3 +__ x 4 +__ x 6 =___ EO __ x 4 +__ x 5 +__ x 7 =___ EQ __ x 3 +__ x 4 +__ x 6 =___ ILF __ x 7 +__ x10 +__ x15 =___ EIF __ x 5 +__ x 7 +__ x10 =___ Total____ One of the participants offered a very perceptive observation, “Isn’t this a lot of work for every user story in Agile?” It could be. In practice though, by the time a user story is defined and understood, the software problem has been decomposed to the point where identifying the FPA functions and complexities is fairly simple. That said, we don’t recommend this for all agile team members. Story points work fine for most agile teams. Where function points (and SNAP) can and must be used for Agile is where there is a need to aggregate the delivered functionality (and non-functional elements) into higher level metrics for reporting to management. This level of function point analysis is often better done by a separate, central team rather than the agile team members themselves. This post was originally published at https://www.softwarevalue.com/insights/blog/posts/2017/january/function  Outsourcing software development projects requires vigilance in order to realize the anticipated gains. The hard-fought negotiations to ensure a little bit less cost for the client with a worthwhile profit for the vendor are over for another year or two and the actual work can (re)commence.
What impact will the new software development outsourcing contract have on the behavior of the vendor? Probably the vendor will be looking to save costs to regain lost margin. With the best intentions in the world, this probably means quality is at risk, even if only in the short term. Why? Because the vendor will probably choose to do one, or all, of the following: Push more work through the same team: introduce new, cheaper resources to the team; cut back on testing. How can a client monitor for these software vendor management changes? First and foremost, you need good data. It is not helpful to start to gather data after you think you might have detected a problem with delivered code. The only data that will be useful in a discussion about diminishing quality from development outsourcing is trend data (I will return to this point at the end). That means that the client must be capturing and analyzing data continuously – even in the good times. It you tell me that the quality of my code has dropped off recently, I will not believe you unless you can show me concrete data showing me when and how it was better before. What sort of data? The level of defects found by severity in any acceptance testing should be included. However, with many clients these days having only limited software development capabilities themselves, I would also recommend that all delivered code should be passed through a reputable static code analysis such as CAST, SonarQube or Klocwork. These tools provide a deeper analysis of the quality of the code, new metrics and, by comparison with previous runs on previous code deliveries, the impact of the current code delivery – did it improve or diminish the overall quality of the application being worked on. Clearly, the former is desirable and the latter is a cause for discussion. Some care needs to be taken before diving headlong into an untried static code analyzer. Poor examples of the breed tend to generate many false positives –sometimes so many false positives that the credibility and value of the tool is lost. From personal experience, I also like to see the results of formal code reviews carried out on the code by the developer and one of his colleagues. To quote a RogueWave white paper, “The value of code review is unarguable, which explains why they’re mandated by 53% of today’s software development teams.” Many years ago, during my time managing a large software development group at Sanchez Computer Associates (now part of FIS), we faced the challenge of maintaining and improving code quality on our complex core product while increasing the number of developers to meet demand. Code reviews seemed to be a good answer because we had a group of very experienced developers who could teach and mentor the newcomers. The problem was that the old hands were just as much in demand to get code out of the door so didn’t have the time to review all the code being produced by everyone else. They, not I, came up with a good compromise. They devised a set of programming standards in the form of a checklist that every programmer, including the most experienced developers would apply to their code before unit test. This caught a lot of minor problems through the simple repetitive reminder exercise. Next, the programmer would do a quick review of their checklist and code with a colleague who could do quick “spot checks.” Finally, if any coding defects were discovered in subsequent test or use, the lessons from these were captured in an updated checklist. From a software vendor management perspective, I see the collection and review of these checklists as being a form of commitment from individual team members that their code is “done.” Returning to my point about trend data, being the only currency for a software vendor management discussion, in my experience these discussions proceed very differently if the data collected before the contract (re)negotiation are used to set some expectations in the contract. Not necessarily service level agreements (SLAs), because these may be reserved for more important issues such as cost, productivity or customer satisfaction, but certainly the recording of an expectation that quality metrics will meet or exceed some average expectations based on prior performance from this software vendor (or the one they are replacing). This post was originally published at https://www.softwarevalue.com/insights/blog/posts/2017/january/software-vendor-management-and-code-quality/ Photo By Markus Spiske (https://unsplash.com/photos/xekxE_VR0Ec) [CC0], via Wikimedia Commons  Software value can take many forms but the ability to respond quickly and flexibly to new business challenges separates “just so” software architecture from high-value software architecture. To this end, over the past 20 years, we have seen many steps down the path from monolithic applications to client-server to service-oriented architectures (SOA). Now, organizations seeking to maximize the business value of their software architectures are adopting microservices architectures.
Microservices, as the name suggests, should represent the smallest unit of functionality that aligns to a core business capability.That’s not to say that each business process or transaction is a single microservice but rather that business processes and transactions are “composed” using microservices. Sounds like SOA? Well, yes, it did to me too, at first. The major difference, I think, is that this time the industry has got out ahead of the curve, learned from the challenges that we all had/have with SOA and built the necessary infrastructure to standardize and support the microservices from the beginning. For example:
This last bullet hints at some of the challenges of a microservice architecture. Development needs to be highly automated with automated deployment to keep track of all the microservices that need to be composed into a particular application and continuous integration. However, the adoption of a microservices approach also requires strong discipline from developers and the devops team. Fortunately, the “small is beautiful” nature of most microservices means that the development teams can (and should) be small so team discipline and communication can be maximized. Implementating a microservices architecture is not something to try on your own for the first time. There a number of companies that have already developed strong experience in architecting and development microservices including our own Spitfire Group who have done a number of implementations including a back-office upgrade for a Real Estate firm. I believe that organizations should seriously consider enhancing the business value of their software by implementing microservices architecture for their “leading edge” products or services. By “Leading edge,” I mean those software-based products or services that are most subject to change as the business environment changes. They are probably customer-facing applications which have to respond to competitive changes in weeks not months. They are probably going to be applications whose software value rests on they’re being fit for purpose all the time. This post was originally published at https://www.softwarevalue.com/insights/blog/posts/2017/january/microservices-in-software-architecture/  Software estimation in simple terms is the prediction of the cost, effort and/or duration of a software development project based on some foundation of knowledge. Once an estimate is created, a budget is generated from the estimate and the flow of activity (the planning process) runs from the budget.
Software estimation can significantly impact business value because it impacts business planning and budgeting. One challenge is that most organizations have a portfolio of software development work that is larger than they can accomplish and need a mechanism to prioritize the projects based on the value they deliver to the business. This is where estimation can help – they predict the future value of the project to the business and estimate the cost of the project in resources and time. Unfortunately, the estimates are often created by the people that are performing the actual day-to-day work not estimation experts. Worse, new estimates from the people doing the work are typically based on their recall of previous estimates, not on previous project actuals – very few organizations take the time to report the actuals after a project is completed. To most accurately estimate a software development project’s future business value, it is best to generate the estimate based on the actuals from similar past projects and statistical modelling of the parameter that are different for the next project. Of course, an estimate is only an estimate no matter who develops it. You can’t predict all the factors that may require modifications to the plan. This is where the estimation cone of uncertainty comes in. The cone starts wide because there is quite a bit of uncertainty at the beginning around the requirements of a project. As decisions are made and the team discovers some of the unknown challenges that a project presents, then the cone of uncertainty starts to get smaller towards the final estimate. In regards to business value, the cone of uncertainty is significant because of the impact that the rigid adoption of early estimates can have on the budgeting and planning processes, especially if the software development effort is outsourced.I see software estimation as both a form of planning and input to the business planning process. However, there is a a significant cross-section of the development community that believes #NoEstimates is the wave of the future. This is a movement within the Agile community based on the premise that software development is a learning process that will always involve discovery and be influenced by rapid external change. They believe that this dynamic environment of ongoing changes makes detailed, up-front plans a waste of time as software estimates can never be accurate. Using #NoEstimates techniques requires breaking down stories into manageable, predictable chunks so that teams can predictably deliver value. The ability to predictably deliver value provides organizations with the tool to forecast the delivery. In my view, the #NoEstimates philosophy really isn’t not estimating – it is just estimating differently. Whether you use classic estimation methodologies that leverage plans and performance to the plans to generate feedback and guidance, or follow the #NoEstimates mindset that uses both functional software and throughput measures as feedback and guidance – the goal is usually the same. They are both a form of planning and input to the business planning processes that are aimed at driving the business value of each software development initiative. This post originally appeared at https://www.softwarevalue.com/insights/blog/posts/2017/january/how-software-estimation-impacts-business-value/ 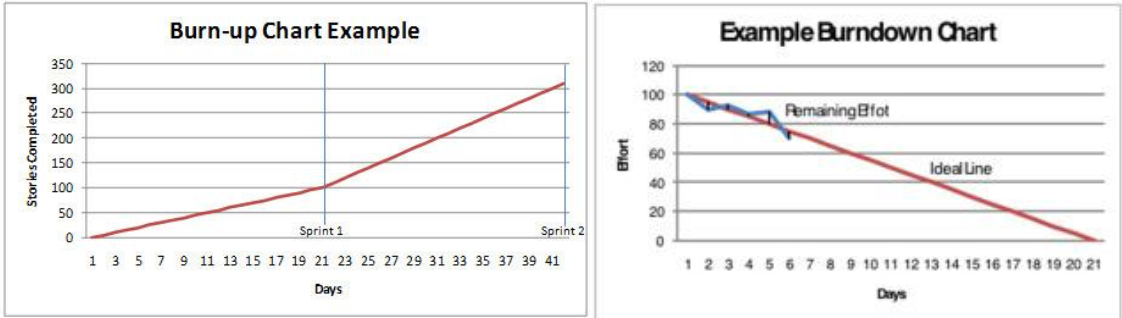 Scope of Report It is commonly accepted that most organizations today have moved, are moving, or are evaluating a move toward the use of the Agile methodology. This report considers: (a) why the move to Agile; (b) what it means to adopt the Agile methodology to incur a transformation; (c) how to measure to know if your transformation is successful; and (d) how to ensure that the effects of the transformation are continued. Why the move to Agile? An IT organization has certain responsibilities that relate directly to their business client and the rest of the organization. From a business perspective, there are five (5) core goals for any IT team.
What is Agile transformation? Tom Cagley has suggested that a transformation is a “complete or major change in someone's or something's appearance, form, etc.”; in other words, a changeover, metamorphosis, transfiguration, or conversion. Transformation “evokes a long-term change program that will result in a large-scale, strategic change impacting a whole organization (or at least a significant part)”. For Agile, it means fostering an environment of teamwork, trust, and open communication to facilitate continuous or frequent delivery of working software. When an organization embraces such a change, it typically has gone through several stages. First, discovery -- a realization of organization needs and how you will attempt to fulfill the needs through a process solution. This is also characterized by knowledge gathering and process analysis. Secondly, proof-of-concept coordination through the organization to solicit sponsors and stakeholders, and assign participants to test the solution. This is executed through a pilot program, or a sampling of teams to use Agile, to generate interest and enthusiasm. Using the lessons learned, and positive and negative feedback, the organization then moves to definition, a more structured approach to implementing Agile. The last phase is institutionalization, in which the transformation is complete, and Agile is used throughout the organizational IT community. This is exemplified as not just a practice, but a ‘core foundation’ based upon innovation and business value. Do we only start to measure when institutionalization occurs, or do we measure through all the process steps to realize when we have arrived at transformation? Obviously, the answer is that we implement metrics as the process evolves to be able to measure process outcomes, adjust the implementation as necessary, continuing to progress until the goal is reached. What then do we measure to gauge transformation? Scrum is a common approach to implement Agile project management. Other Agile and Lean frameworks include Extreme Programing (XP), Crystal, and Scaled Agile Framework Enterprise to name a few. The measures and metrics mentioned in this paper can be applied to most if not all. There are several key metrics that are used to measure the Scrum environment. To review the terms and the process, the following is the framework which is being measured.
1. Velocity and Productivity According to the Scrum Alliance: “Velocity is how much product backlog effort a team can handle in one sprint. This can be estimated by using the historical data generated in previous sprints, assuming the team composition and sprint duration are kept constant. Once established, velocity can be used to plan projects and forecast releases.” Velocity is a measure of throughput - an indication of how much, on average, a particular team can accomplish within a time box. Velocity can be gauged by the number of user stories delivered in a sprint, by the number of story points delivered in a sprint, or by the number of function points delivered in a sprint. Since user stories are not generally considered equal in complexity or time to develop, they have too much variability to be a reliable measure. Story points are subjective and are generally only consistent within a stable team. Again there may be too much variability to measure at an organization level, or across teams. While story points provide the micro view within teams, we need some way to measure the macro view across multiple teams. Function points can be used at the inception of the project to size the backlog, to determine the deliverability of the minimum viable product and to capture actual size at completion. This allows a quantitative view of volatility. In addition, function points are a rules based measure of size, therefore, can be applied consistently and are useful for standardizing velocity or productivity. Productivity is size/effort, expressed as function points delivered per FTE or team member. Using function points as a basis for size, an organization can compare performance within dynamic teams and to the industry through the use of agile benchmark data. 2. Running Tested Features (RTF) In general terms, the Running Tested Features (RTF) metric reflects “how many high-risk and high-business- value working features were delivered for deployment. RTF, counts the features delivered for deployment denominated per dollar of investment. The idea is to measure, at every moment in the project, how many features/stories pass all their (automated) acceptance tests and are known to be working”. The two components are time (daily) and the number of running, tested features ready for delivery to the business client. This metric is often used in environments where operations or production environments are “owned” by separate organizations (often true in DoD and Government environments). 3. Burn down/Burn up charts According to Wikipedia, “A burn down chart is a graphical representation of work left to do versus time. The outstanding work (or backlog) is often on the vertical axis, with time along the horizontal. That is, it is a run chart of outstanding work. It is useful for predicting when all of the work will be completed.” A burn up chart tracks progress towards a project's completion. In the simplest form, there are two lines on the chart. The vertical axis is amount of work, and is measured in units customized to your own project. Some common units are number of tasks, estimated hours, user stories or story points. The horizontal axis is time, usually measured in days. These charts can allow you to identify issues (e.g. scope creep) so adjustments can be made early in the cycle. They are also effective tools for communicating with clients and management. The advantage of a burn up chart over a burn down chart is the inclusion of the scope line. It also allows you to visualize a more realistic completion date for the project, by extending a trend line from the scope as well as the completion line. Where the two trend lines meet is the estimated time of completion. 4. Technical Debt Technical debt is a measure of the corners cut when developing a functionality (e.g. to prove that the functionality can be implemented and is desirable) the code may be written without full error trapping. As technical debt increases, it can become harder to add new features because of constraints imposed by previous poor coding. The measurement of technical debt was introduced in parallel with Extreme Programming (XP) which introduced the concept of “refactoring” or regularly revisiting inefficient or hard to maintain code to implement improvements. XP builds in refactoring, restructuring and improving the code as part of the development process. Technical debt is typically measured using code scanners which use proprietary algorithms to generate a metric based on the number of best practice rules that a particular piece of code infringes. 5. Defect Removal Effectiveness (DRE) and Defect Escape Rate (DER) Measuring quality has always been a key metric, regardless of the life cycle methodology. The two key metrics in this area measure the ability to remove defects prior to release where: 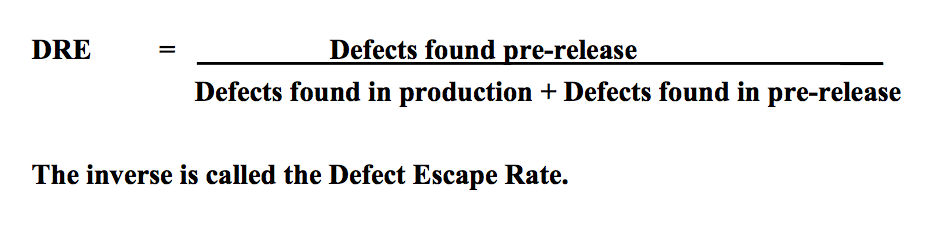 The question usually arises over the time frame for a ‘release’. Quite simply, it depends on your delivery schedule – if you do a real release every 2 weeks, then that may be your measure of time. It is important to be consistent. As with any defect measurement, you will have to decide what priority defects are considered and are they all treated equally in the equation.
6. Work Allocation There are three team metrics which can be used to support the outcomes of other metrics (cause and effect). The organization makes a sizable investment in building a solid cross-functional team with the right expertise for the product development. To protect the investment there is a key focus on building core product teams with deep product and technology knowledge. Rotating team members reduces the team scalability as continuity is constantly broken between releases. The following metrics are mainly targeted to gauge impact of team assignments, team changes between releases, and how the time is actually used – all which can affect delivery and costs: 1) Team utilization is quantified by the Team Utilization Quotient (TUQ). TUQ = Average time spent by team on the project Example: Utilization is 10 resources for 5 months project. - 4 resources joined in the beginning - 2 resources joined after 2.5 months (50% project left) - 4 resources joined in the last month of the project (25% project left) TUQ = {(4*1)+(2*.5)+(4*.25)}/10 = .60 = 60% 2) Team scalability is quantified by the Team Scalability Quotient (TSQ): TSQ = % of the team retained from the previous release In a TUQ example, we built a team of 10 people. The team had low utilization because of team assignments. Assuming the team is ready to take on next the version of the product, if you replace half of the team members with newer members to work on the new product release it reduces team scalability by 50%. The third team metric is Work Allocation. This is a simple chart showing what percentage of available time was spent across all work categories for the sprint. Time activities should not only consider development activities but must include the time spent with clients, customers and stakeholders. In Agile, which fosters a cooperative environment, time needed for communication and feedback is as important as the time to code and test. The use of these metrics should encourage resource managers, Scrum masters and Scrum coaches, to carefully consider how time and resource allocation impacts team efficiency and scalability. The transformation of the organization is from hero building to team building, and if you want to gain a fair ROI, you will invest in developing cross-functional teams. Obviously, disrupting teams will not generate the delivery responses you seek. Conversely, as team dynamics are fostered and improve, so will velocity. 7. Customer Satisfaction and Team SatisfactionLast but certainly not least, one of the measures which is highly revealing of performance is customer satisfaction. Customer satisfaction answers the question of whether the client is happy with the delivery, quality and costs of the functionality being delivered. Satisfaction provides a view into how the team is perceived by the clients. Team satisfaction measures how the team is affected by agile adoption. Agile transformation provides an environment that values technical innovation, collaboration, teamwork, and open and honest communication which yields higher team satisfaction. Team satisfaction is positively correlated to productivity. Team satisfaction can be an indicator of how well the organization has implemented Agile. How do you know that the effects of the transformation will continue? The most common answer is “you don’t know for sure”. As a matter of record, experience has shown us that without continued measurement and adequate coaching, teams fall into entropy and lose efficiencies. A measurement feedback model should be in place to monitor performance levels, to know when to get coaching and how to address process improvements as needed. At any point in the transformation, an independent assessment may be in order to determine where you are in comparison to where you want to be. Feedback from an assessment is critical for developing a fact-based plan for improvement. Conclusion The journey to transformation involves a cultural organizational change which can be thoroughly measured using common Agile metrics. The efficiencies of the new Agile environment can be quantified, maintained and improved through the use of a continuous measurement framework and periodic independent assessments. References SPAMCAST, Tom Cagley. Nov 2015. So You Want A Transformation! https://tcagley.wordpress.com/2015/11/10/so-you-want-a-transformation/ Agile Metrics: Running Tested Features, 9 June 2014, https://www.scrumalliance.org/community/articles/2014/june/agile-metrics-(1). Wikipedia Burn down chart https://en.wikipedia.org/wiki/Burn_down_chart. Metrics Minute: Burn-Up Chart, Tom Cagley. https://tcagley.wordpress.com/?s=burn+up Metrics Minute: Burn-Down Chart, Tom Cagley. https://tcagley.wordpress.com/?s=burn+down Clarios Technology: What is a burnup chart?,http://www.clariostechnology.com/productivity/blog/whatisaburnupchart Technopedia: Technical Debt, https://www.techopedia.com/definition/27913/technical-debt XBOSOFT: Defect Removal Effectiveness Agile Testing Webinar Q&A, https://xbosoft.com/defect-removal-effectiveness-agile-testing-qa/. Agile Helpline: Agile Team's Efficiency in Various Resource Allocation Models. http://www.agilehelpline.com/2011/05/agile-team-efficiency-in- various.html DCG Software Value. Webinar: Agile Metrics What, When, How, David Herron. Nov. 2015. This blog was originally posted at https://www.delcohvac.com/6-common-air-pollutants-lurking-your-home/. #Trusted Advisor, #Agile, #Agile transformation  If there is one time when business value is front and center in a conversation, it is during a merger or acquisition process. The acquiring company wants to know the true value of the company it’s acquiring and the company being acquired wants to prove its value as a viable option for acquisition. In the case of a merger, both companies have these same two concerns – what is their real value and what is the value of the company with which they are potentially merging? In today’s organizations, technology, and more specifically, software is an aspect that needs to be carefully assessed to determine its value to the M&A deal as an asset or potential liability (i.e. requiring significant upgrades or maintenance or performing poorly). To begin the evaluation process, I recommend looking at the software in relation to the business functions of the target company. Is the software unique to the company’s line of business or is it used for a business function that is common between the two organizations (i.e. HR, payroll, CRM). Most likely, the software that is performing the same function in both companies will be of little business value to the acquiring company as they will choose to keep their existing software. However, a software solution that is unique to the target company could have tremendous value. The challenge is that the acquiring company may not be familiar with the software and have a limited understanding of its value or the risk associated with that software. In addition, if there are only a few individuals who understand how to use and maintain the software (especially with proprietary software) there is a risk that they will not remain at the company and as a result there will be no knowledgebase to maintain and/or enhance the software. I recommend taking four key steps during the acquisition process to determine the value of the target company’s software:
A software assessment needs to be an integral part of the M&A process – no matter what end you’re on. It can no longer be an after-thought. Software can provide significant value or pose a huge risk for an organization and that needs to be determined up front. I’m always interested in hearing from others about your experiences on how your organization has handled the software assessment process during a merger or acquisition. What lessons have you learned? Mike Harris CEO This blog was originally posted at https://www.softwarevalue.com/insights/blog/posts/2016/november/four-steps-to-assessing-software-value-in-an-ma/. #Mike Harris, #Mergers and acquisitions, #mergers, #acquisitions, #software value  Software development is a team effort. Agile software development, in particular, depends on a high level of communication between team members. In order to be able to improve the business value they are delivering, it is important that the software development teams conduct regular self-assessments. By taking the time to conduct an in-depth assessment of the key areas that impact team performance and health, an organization can make modifications to their processes to enable continual improvement that can lead to increased business value.
In Agile, teams typically rely on sprint retrospectives to analyze their performance for continuous improvement. The challenge is that these events are team- and sprint-specific and often become wasteful ceremonies in that they don’t add any new value. It is common for the team to reach a point where they have discussed and fixed the things they can fix and the things they can’t fix require organizational intervention, which is outside their span of control. It is easy – and probably correct – for teams in this situation to conclude that sprint retrospectives should be abandoned because, from a lean perspective, they are not adding value and so represent waste to be removed. Over the years, our team has leveraged the AgilityHealth℠ Radar (AHR) TeamHealth Assessment as an event to review team dynamics on a quarterly basis. This structured, facilitated event is an opportunity for a more strategic review than the sprint retrospective typically allows.. There are five vital areas that can impact the health of an Agile team: Clarity, Performance, Leadership, Culture, and Foundation. Each should be carefully evaluated to help the team identify their strengths, areas of improvements and top impediments to growth. From there, a growth plan outlining the target outcomes for the following few months can be developed. The true value of an assessment like this comes from the open and honest conversations that take place enabling the team to evaluate their performance and outcomes and continually improve their processes for the future. Does your software development team regularly assess the team’s performance and make adjustments for future growth? If so, is there a specific methodology your organization uses? Mike Harris CEO This blog was originally posted at https://www.softwarevalue.com/insights/blog/posts/2016/october/measuring-software-value-using-a-team-health-assessment/. #Mike Harris, #AgilityHealth Radar, #Agile development |
